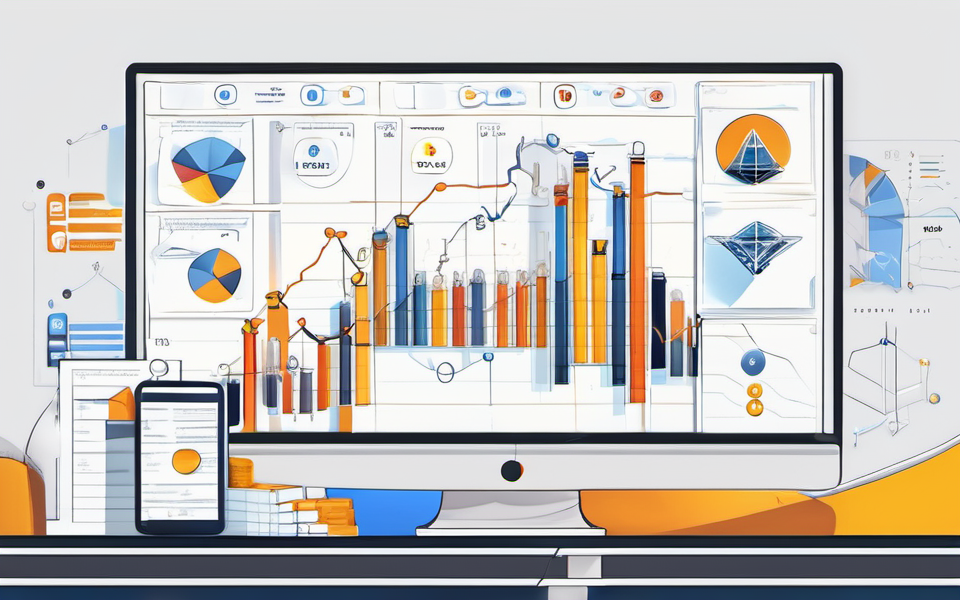
You Think You’re Good at Reading Charts? Let’s See You Decode This Crypto Chaos!
Ever stared at a crypto chart and felt like you were staring into the abyss? It’s like trying to decipher hieroglyphics while on a caffeine bender – it’s colorful, chaotic, and confusing as heck. Don’t worry, friend, you’re not alone! Welcome to the club, where even seasoned crypto investors scratch their heads at the wild ride of digital asset charts.
Crypto Charts: It’s All Fun and Games… Until It’s Not!
Imagine this: you’re a proud owner of a crypto wallet (hooray!) and you’re excitedly looking at your Bitcoin chart (the big cheese of the crypto world, if you will). All you see are spiky green lines – everything’s going up! You’re feeling like a crypto trading pro! Then, BAM! It crashes faster than your last online shopping spree, and you’re left questioning your life choices (and your investment strategy) – it’s enough to make you want to Hodl and just… give up.
So, what’s a newbie crypto investor to do? Don’t despair! We’re about to unlock the secrets of deciphering crypto charts in a way that even a seasoned chart analyst can appreciate (hopefully!).
The Big Players in Crypto Chart Drama
Forget your college art class – we’re diving headfirst into the world of cryptographic charts, and we’re bringing our own set of rules. You’ll get your art appreciation lesson in candlestick patterns, technical indicators, and a few crypto trading strategies for good measure.
Candlestick Patterns: The Stars (and Bears) of Crypto Charts
The first step to unlocking the cryptographic mysteries is to get familiar with the key characters in the game – the mighty candlestick patterns. They’re the bread and butter of crypto chart analysis, giving us valuable clues about the price movements of digital assets like Bitcoin, Ethereum (a close second to Bitcoin!), and other altcoins (everything else in the vast cryptocurrency market!).
Think of each candle like a tiny little story about price fluctuations:
-
Green Candle: “Woohoo, things are going up!” A bull market! (Think about a bull with its horns pointed upwards)
-
Red Candle: “Uh oh, we’re in trouble! Prices are dropping.” A bear market! (Imagine a bear swiping down a delicious salmon)
Now let’s combine our little stories! Here are some popular patterns, in all their dramatic glory:
-
Bullish engulfing pattern: A red candle followed by a green candle. This can be a strong signal of an impending upward trend. It’s like the bullish green candle just “engulfed” the weak red one!
-
Bearish engulfing pattern: A green candle followed by a red one. A sad situation – it’s a signal that the market might fall (the red candle engulfed the optimistic green candle).
-
Doji: This looks like a cross – it tells us the price stayed about the same at the opening and closing. Market indecision reigns supreme.
-
Shooting star: This one’s a bear market alarm – it looks like a small green candle followed by a long red “tail”.
Think of candlestick patterns like a short-form play about the crypto market. Every candle has its unique personality, and together they tell the story of market volatility!
Technical Indicators: Don’t Go Blind – Let the Indicators Guide You!
Hold onto your hats, friends – we’re entering the realm of technical indicators! Think of them like trusty advisors in the world of crypto trading. These metrics can help predict the price movements, revealing patterns that the naked eye might miss.
Remember those colorful lines we talked about earlier? Well, technical indicators come in the form of lines, bands, and oscillators. Let’s unravel some popular ones:
- Moving averages (MA): Think of these like smooth flowing rivers through the market’s storm. They help us visualize the trend – whether the digital asset is heading up or down. They’re calculated by averaging the closing prices of a period of time.
- Relative Strength Index (RSI): This one checks how overbought or oversold the digital asset is. It uses the magnitude of recent price changes to evaluate if it’s time to buy or sell.
- Bollinger Bands: Like safety nets, these bands set upper and lower limits to show the typical range of the asset’s price movements.
- MACD (Moving Average Convergence Divergence): This indicator helps you catch the momentum of price movements – it’s great for timing your entries and exits in the market.
Technical indicators help us see the big picture. It’s like adding those fancy 3D glasses at the movie theater; we can see more depth in our chart analysis!
## Making Sense of the Madness: Crypto Trading Strategies
Equipped with your knowledge of candlestick patterns and technical indicators, let’s explore some popular crypto trading strategies! This is where you go from a casual observer to a crypto warrior wielding your knowledge like a weapon!
Scalping: This one’s for the lightning-fast trader. It involves profiting from small price swings, entering and exiting trades quickly. Imagine catching a few pennies in a fountain – quick and frequent profits!
Day trading: Day traders are like speed demons – they hop in and out of trades within a day. This is a fast-paced world where market sentiment, news, and volatility can make or break your trades!
Swing trading: A bit more laid-back than day trading, swing traders focus on capturing medium-term price movements, holding onto their trades for a few days to weeks. Imagine letting your winnings simmer like a pot of stew – the longer you cook, the tastier the result!
Trend trading: This strategy rides the long-term waves. Trend traders look for the broader, longer-term trend – like watching a gentle ocean wave rolling in.
Crypto Chart Analysis: It’s Art, It’s Science, It’s Magic!
It’s safe to say that analyzing crypto charts is like unlocking a secret code. Understanding candlestick patterns, navigating through technical indicators, and implementing crypto trading strategies are just some of the ingredients in your recipe for chart mastery. But remember, crypto is still a volatile market. Be cautious, be smart, and do your due diligence before diving into any investment decisions!
Key Takeaways
- Crypto charts are your map to navigate the volatile world of digital assets. Learning to read them is essential for successful crypto investment
- Candlestick patterns are like little stories about the market’s direction, each with unique personality!
- Technical indicators like moving averages, RSI, and Bollinger Bands help uncover hidden patterns in the market – think of them as a crystal ball!
- There are many crypto trading strategies you can employ, but the most important rule is to adapt your strategy to the specific market conditions and risk tolerance.
*So, the next time you see a complex *crypto chart, don’t run away in fear! Armed with this newfound knowledge, you can approach those colorful charts with confidence. Remember, even a master artist learns their craft with time and practice!


